Data warehousing is a critical technology for organisations of all sizes. By bringing together data from disparate sources into a single repository, data warehouses can help organisations make better decisions, improve customer service, and increase profits.
Data visualisation is an important tool for data analysis. By visually representing data, it can be easier to understand trends and patterns that would be difficult to see in raw data.
To provide a comprehensive understanding of data warehousing concepts and techniques
To provide an opportunity for students to create a data warehouse using open source technologies and open source public data sets
To provide a comprehensive understanding of why data visualisation is important and how this communicates insights better than traditional reporting techniques
To provide students with an opportunity to create data visualisations and combine such visualisations into a single dashboard so as to tell a "data story"
Topic
Write an initial discussion forum post of around 500 words describing what you consider to be one of the main challenges of data warehousing. Choose an appropriate title for your discussion forum post and focus on a particular topic such as data cleansing, missing data, data consistency, combining data from different sources, or anything else you feel might be a significant challenge for data warehouse users or developers. You should discuss the problem as well as potential solutions and your own feelings about the topic.
Post
Data warehouse consistency with various sources is certainly one of the main challenges of data warehousing. Data consistency is indisputably vital for accurate decision-making, effective operation, and regulatory compliance (Hu, 2023). Even when the data is imported from different databases, legacy systems, and external sources into a data warehouse, the data consistency issue becomes more and more complicated. Different data formats, different data quality, and varying data definitions can be the cause of this issue. Besides, data volumes are growing, and organisations are implementing new technologies. This makes data consistency even more challenging to maintain.
According to an article by Atlan (2023), to solve the problem of data consistency in data warehousing, organisations are required to adopt comprehensive data governance frameworks and standardised data management practices. This includes the development of clear data consistency rules, data quality metrics definition, and the assignment of data stewards to supervise data integrity. Also, the use of data profiling tools can assist in detecting irregularities and inconsistencies in the data integration process as early as possible, therefore ensuring timely cleaning and transformation of the data (Segner, 2023). Besides, the automated consistency checks and validation processes will enable data quality assessment and warn the deviations from given criteria. By emphasising data consistency and the implementation of the proper tools and processes, an organisation will be able to minimise the risks related to inconsistent data in its data warehousing programs.
I consider data consistency in data warehousing to be something both difficult and intriguing. With data playing a more and more important role in business organisations and decision-making, it ought to be correct and truthful (Farrell, 2023). Details related to data consistency across heterogeneous sources and systems underline the necessity of careful planning, close attention to detail, and permanent development. Although the task may look like a difficult one, it can be achievable if appropriate strategies, technologies and organisations are put in place. There is a need for effort from stakeholders across the organisation, but the payout from better decision-making, operational efficiency, and regulatory compliance is just the case worth the investment.
Data consistency is one of the most important things to think about in data warehousing. To make smart business choices, it is imperative to ensure that data is reliable and consistent across many systems, sources, and time periods (Jiang et al., 2021). Nevertheless, making sure that data is consistent-and-keeping it that way is hard and needs to be carefully thought through.
The problem
In a data warehouse, "data consistency" basically means that the data is correct, reliable, and the same all the way through. This means taking care of a number of important things. First, every system and report that needs to be changed or updated must be in sync with every other system-and-report. It's very important to be on time. Any change in how often data is updated could lead to differences that make it harder to make smart choices. Furthermore, precision is very important since mistakes in entering, copying, or changing data put the whole dataset at great risk (Jiang et al., 2021). If there aren't strong ways to find and fix mistakes, people who make decisions might base their choices on wrong information. Finally, it's hard to integrate data stores since they get information from many places, each with its own structure, style and quality (Jiang et al., 2021). To try to put all of this different information together in a way that makes sense and keeps its structure, it is utterly important to pay close attention to every detail and-use advanced integration methods.
Potential solutions
Getting rid of inconsistent data in a data warehouse needs a thorough and well-thought-out plan. One important way to deal with the problem is to make sure that the data is consistent, which needs strong data governance tools. These models have clear steps-and instructions for determining data ownership, setting high standards for data quality and ensuring that the data is always matched- (Jiang et al., 2021). Data that doesn't match up can also be found and changed with the help of technologies for data quality, like software for cleaning, deduplicating, and profiling data. Automating these tasks can save businesses time and money by cutting down on the amount of work that needs to be done by hand. Master Data Management systems let you handle master data in a way that is accurate and the same across your whole company (Jiang et al., 2021). MDM makes it easier to handle data that isn't consistent across multiple sources by making a single source of truth for important things like locations, customers, and products. Lastly, good data integration methods make it easy to combine data from different sources in a consistent way (Jiang et al., 2021). Methods like data federation and extract, transform, load (ETL) can be utilized to do this. When you combine these technologies, you get a more stable-and-uniform data environment that helps businesses grow by giving them the information they need to make smart choices.
Personal Reflection
Figuring out how to keep data consistent in a data warehouse can be hard and helpful at the same time. Since I work in the data business, I know how important it is to give decision-makers correct, reliable, and consistent data. I do know, though, that reaching this goal will be hard and require making trade-offs. I agree that company culture and policies are just as important as technical solutions like MDM and data quality tools when it comes to fixing problems with data consistency. Building a mindset of data stewardship and responsibility along with strong governance structures makes it possible to keep data consistent over time instead of seeing it as a one-time fix.
References
Jiang, Y., Jeusfeld, M., & Ding, J. (2021). Evaluating the Data Inconsistency of Open-Source Vulnerability Repositories. Proceedings of the 16th International Conference on Availability, Reliability and Security. https://doi.org/10.1145/3465481.3470093
Topic
Understand the main application areas of agent-based solutions, and be able to develop a meaningful agent-based system using a contemporary agent development platform.
Background
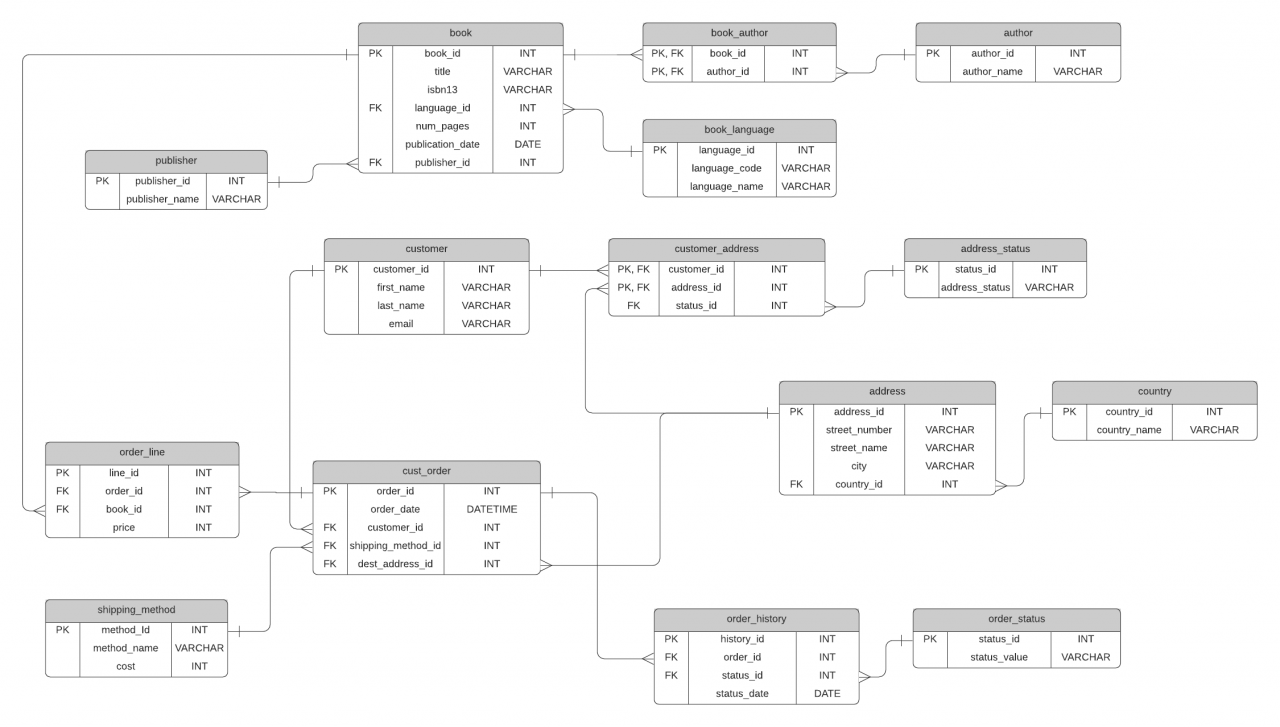
For this assignment you are to take on the role of a specialist tasked with setting up a data warehouse for the Gravity bookstore marketing department who would like to look into how a recent marketing campaign has affected international book sales and particularly the sales of books in languages other than English.
The structure of the operational database used by the bookstore is shown below.
They also recently conducted a survey of their customers to find out how they first heard about the bookstore, how they prefer to buy books, and why they prefer to use the Gravity bookstore rather than any other supplier. The results of the survey are held in a CSV text file.
The business questions presented in your initial meeting with the marketing department representatives are as follows.
Where are the customers who buy are books and how has the location of customers changed over time?
Where do our customers prefer to buy non-English language books and how has the demand for non-English language books changed over time?
Tasks
In order to meet the requirements of this assignment you will need to complete the following tasks.
Use the sql files to create the Gravity bookstore operational database.
Design a data warehouse schema based on the Gravity bookstore operational database that can be used to answer the marketing department business questions. For simplicity, it is recommended that this is a star schema.
Create staging tables for the transfer of the data from the operational database to the data warehouse.
Develop control-flow and data-flow procedures to extract the data from your operational database to your staging tables.
Extract the data to your staging tables.
Create the schema for your data warehouse.
Develop control-flow and data-flow procedures to transform and load the data to move it from your staging tables to your data warehouse.
Perform data cleansing to check for any issues with the data. Due to the limited time-scale of the project, more advanced checking involving automated scripts etc. is likely not feasible. However, you should at least consider which checks should be prioritized and how these could be implemented.
Develop a visualization interface that uses the target tables of your data warehouse to answer the marketing department’s business questions. This can combine more than one visual representation of the data.
Write a report of 1000-1500 words to describe the above process of data warehousing and data visualization. The content of the report is described below.
Report Requirements
The report to be submitted for this assignment should contain the following.
ER diagrams showing the schema for your staging tables and the target tables of your data warehouse.
Diagrams describing how the data is extracted from the operational database to the staging tables.
Diagrams describing how the data is transformed and loaded into the target tables of your data warehouse.
Screenshots of your visualization demonstrating how they can be used to answer the business questions from the end users.
A description of the design process for your data warehouse schema and ETL process including an explanation of key design decisions such as how you interpret the user requirements and relate these to the data. You should include any assumptions made for the design and discuss the alternative design options considered.
A description of the development process including any steps made to debug your design and any changes to the design made during the development process.
A description of the data cleansing process including the checks made, issues found, and how the process could be improved with automated checking etc.
A summary of the lessons learned during the process with ideas on how the it could be improved in future.
This report aims to fulfil the needs of the Gravity Bookstore’s marketing department by developing and applying a data warehouse solution. The primary goal is to study the effect of a recent marketing campaign on international book sales with a focus on non-English language books. This initiative flows from the growing prominence of data-driven decision-making in modern business opera-tions where knowledge poured from comprehensive data analysis drives strategic planning and raises the competitive advantage. The Gravity Bookstore works in a highly intricate environment, and to cope with the dynamic nature of trade, the management needs reliable tools for analysing customer behaviours and browsing market trends. The advent of digital technologies and their general utilisation by marketers have led to a radical transformation of marketing, with both prospects and challenges inherent in this evolution (Pascucci, Savelli and Gistri, 2023, p.30). In response, Gravity Book Outlet aims to capitalise on its data on hand and its cli-ent information so as to have an edge in the market and successfully develop bet-ter marketing strategies.
The main issue in this report lies in defining customer tastes, geographic distribution, and buying habits about non-English language literature books. In performing these investigations, the marketing team intends to design their strate-gies to satisfy consumer requirements and to take advantage of prevailing market opportunities. Furthermore, the report gives specific recommendations that can facilitate strategic management and business performance improvement. The pro-posed solution consists of developing a data warehouse based on the star schema architecture, where data can also be retrieved using the ETL mechanism. Addi-tionally, the report provides steps for data extraction, transformation and loading that are necessary to maintain the consistency and truthfulness of the data moving from the operational database to the data warehouse. Gravity Bookstore has the opportunity to learn from data about customer behaviour and market dynamics, which will then help them develop targeted marketing campaigns and product of-ferings. Data warehousing supports the company's analytical capacity and brings business intelligence to the decision-making process (Fleckenstein and Fellows, 2018, p.125). The implementation of this project has the potential for business de-velopment, customer satisfaction, and positioning of Gravity Bookstore in the in-dustry.
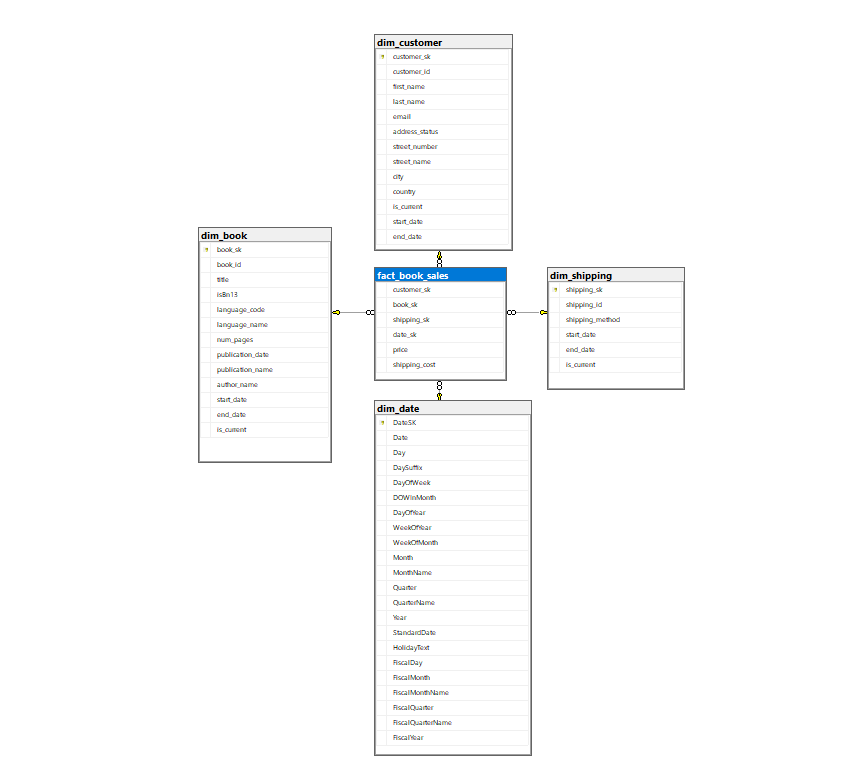
As Gravity Bookstore’s data warehouse employs a star schema design, it allows for faster querying and analysis. The main fact table shows details of book orders, while dimension tables bring related attributes such as customer details, book information, shipping, and date dimensions. The schema map is set up in such a way to indicate analysis from multiple aspects of sales data which is very important for understanding the needs of customers and market tendencies.
Figure 1. Star Schema
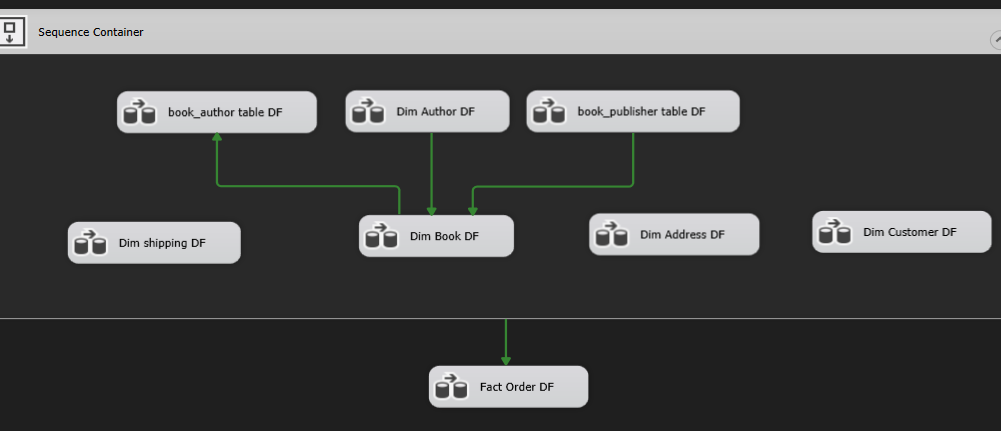
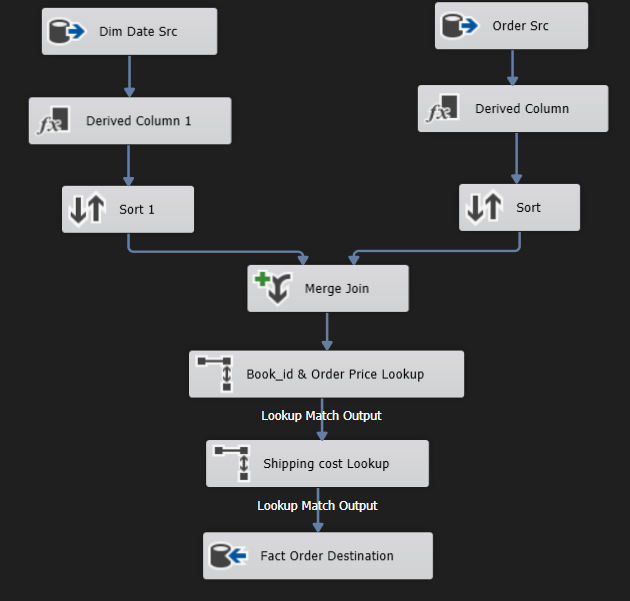
The ETL process is made up of three main components: extracting data from the operational database, transforming it to fit the authorship model, and loading it into the target tables. The control-flow and data-flow techniques are de-signed to manage the process, thus preventing data corruption and ensuring the perfect quality of the transferred data. Figures show the flow of data points going through the ETL stages of extraction, transformation, and loading, which give the visual notion of the ETL workflow.
Figure 2. ETL Process
Data cleansing is the foundational step that was created to ensure the data quality and reliability within the data warehouse. Although we can only do so much because of the limited scope due to time restrictions, however, we are doing our best to carry out such checks as duplicate removal, data validation and con-sistency verification. However, these problems are recorded afterwards, and ways to correct them with automation are then discussed for revisions.
Figure 3. Cleansing
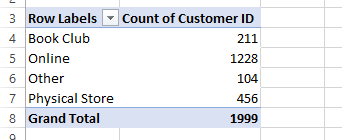
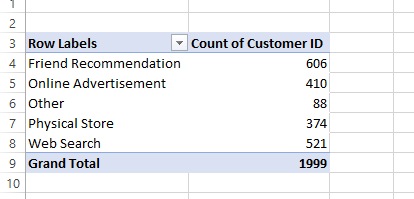
In response to the marketing department's business questions, we imple-mented a Pivot Table in Excel. The screenshot shows how data analytics can be applied to the customers’ preferences, geographical distribution, and demand for non-English language books over time. The visualisation interface provides reports and visualisations in which end users can extract insights that can be exploited for decision-making.
Figure 4. Pivot table Location to buy books
Figure 5. Pivot table for recommendation
The process of development carried various iterative phases such as design, implementation and testing while also considering the user requirements in sched-uling the data warehouse schema. Significant design elements, for example, sche-ma selection and ETL workflow, are mentioned, as well as assumptions made and alternative designs considered. Knowledge gained is presented in the conclusion as an essential part to summarise the lessons and to draw attention to some aspects that should be kept in mind and to find out some changes for the future project. The Gravity Bookstore data warehousing solution is a complete mechanism for inferring patterns from sales data and turning them into useful information. With the business questions in mind and employing visualisation capabilities, the solu-tion enables an accurate decision process and action plan for the marketing de-partment.
In conclusion, our Gravity Books Sales End-to-End Project will create a data warehousing system for the marketing department at Gravity Books Store. Thus, we have been covering multiple points of data warehousing, from schema to ETL and data visualisation, with the purpose of benefiting the organisation with decision-making and increasing efficiency. The most important outcome of this project is to lay the data warehouse foundation that uses the star schema approach to make sales data from all possible dimensions analysable quickly. Besides, the formation of interactive reports and visualisations with the help of Pivot Tables in Excel provides a friendly interface for understanding and exploring the infor-mation (Zhang et al., 2022). Such tools let the end users take rightful action based on their ever-growing pool of sales data. Hence, informed decisions are made in the marketing department.
Although there were also some drawbacks experienced during the imple-mentation stage, the project remains a success story. Limited by time and staff, the scale of the data cleansing and validation processes was less than expected. While basic checks were carried out to guarantee data integrity, the process can be im-proved with the application of comprehensive validation methods to increase the reliability of the data warehouse (Sluzki, 2023). In conjunction, the project had mainly concentrated on solving business questions about customer preferences and purchasing patterns. Subsequent versions of the project can expose the different perspectives and dimensions of analysis, including inventory management, pricing strategies, and customer segments that would comprehensively indicate the level of business operations.
Moving forward, there are several opportunities to conduct research and development for Gravity Bookstore's data warehousing. Next, an exploration of refined data cleaning methods and automated validation techniques can ensure the data warehouse provides accurate and reliable data. Implementing machine learn-ing-based algorithms for predictive analytics and forecast could boost the predic-tive capabilities of the data warehouse, thus facilitating better proactive action and resource planning. In addition, extending the range of scrutiny to incorporate ex-trinsic data sources, for example, market trends and competition analysis, will sig-nificantly benefit when making strategic planning or competitor positioning deci-sions. Moreover, the ongoing study and development of these cutting-edge tech-nologies, including cloud storage, data analytics, and real-time analytics, will pro-vide opportunities for advancement and potential improvements in the approach moving forward.
Pascucci, F., Savelli, E. and Gistri, G. (2023). How Digital Technologies Reshape Marketing: Evidence from a Qualitative Investigation. Italian Journal of Marketing, 2023(1), pp.27–58. doi:https://doi.org/10.1007/s43039-023-00063-6.
Zhang, G., Zhu, Z., Zhu, S., Liang, R. and Sun, G. (2022). Towards a better understanding of the role of visualisation in online learning: A review. Visual Informatics. doi https://doi.org/10.1016/j.visinf.2022.09.002.
inner join order_line OL on CO.order_id = OL.order_id
inner join book B on OL.book_id = B.book_id
inner join shipping_method SM on CO.shipping_method_id = SM.method_id
Topic
write an initial discussion forum post of around 300-500 words describing something you consider to be a potential future trend for data visualization and/or data warehousing. You should choose an appropriate title for your post and focus on a particular trend such as generative AI for data dashboards, mobile visualization, augmented-reality visualization, data-lakes, or anything else you feel has the potential to be a become a significant aspect of data warehousing or data visualization within the next 10 or 15 years. You should tell us why you think this new trend may happen and what opportunities and problems may arise. You are encouraged to use your imagination when choosing a topic and consider any trends that have the potential to become established in the near future. The trend can be something that is in the prototype stage now but it should not already be in wide use.
Tasks
Decide on a topic and title for your discussion post.
Navigate through the existing topics in the discussion forum. If your topic is too close to that of another student, you will need to choose another topic. Note that topics can be related but they should have some substantial difference (for example GAI to generate summary text and GAI to configure dashboards would be considered different topics). Once you have a suitable topic you can post your preliminary discussion title to the topic forum.
Post
With technology developing at a speedy rate, the one possible upcoming trend for data visualization might be its integration into data warehouses, including virtual reality (VR). Virtual reality generates unrivaled immersion and interactivity among all data analysis mediums, whereby information that surpasses or exceeds the scope of traditional 2D dashboards is provided. Among the many emerging aspects of data warehousing that are predicted to become significant within the next decade is that VR offers users an opportunity to be provided with a more intuitive and interactive experience where they can interact with large datasets (Alibaba Cloud Bao, n.d.). Using technologies that induce 3D environments where data can be visualized, users can gain new insights unfamiliar to this method.
Furthermore, VR is rated as a tool for organization management to improve individual and group collaboration through VR employees working in a shared virtual environment. This creates real-time communication between the stakeholders and allows them to make faster decision-making and solve problems more quickly by interacting with data instantaneously. However, VR has several issues when merged with data warehousing. However, there is also a serious requirement for sophisticated hardware and software to make VR applications run, and this might lead organizations to spend more on extra supplies (Mayer et al., 2023). However, data security and privacy are obvious and straightforward problems related to the virtual environment and should be solved properly to preserve data integrity and confidentiality.
The dawning of virtual data perception through VR brings an ocean of opportunities to exemplify how data is examined and annotated. By employing VR's immersive and interactive characteristics, organizations can extract vital insights leading to more solidified decision-making.
Mayer, A., Jean-Rémy Chardonnet, Polina Häfner, & Jivka Ovtcharova. (2023). Collaborative Work Enabled by Immersive Environments. Springer EBooks, 87–117. https://doi.org/10.1007/978-3-031-26490-0_6
Summary
In my initial post, I proposed that generative AI has the potential to significantly reshape the future of data visualisation and data storytelling over the next 10-15 years. Generative AI leverages deep learning models that can create new data visualisations from datasets or natural language prompts (Ali et al., 2024). As these generative models advance and are tailored for data visualisation use cases, they could enable business users to prototype visualisations more rapidly, automate routine charting tasks, and surface novel insights from data.
The key opportunities I see with generative AI for data visualisation are:
Lowering the technical barriers to creating data visualisations, dashboards, and data stories. With generative AI, even non-technical users could generate visualisations from datasets using natural language (Turchi et al., 2023).
Enhancing analyst productivity by automating routine visualisation tasks and enabling rapid prototyping of different chart variations to find meaningful insights faster.
Uncovering novel insights and visualisation approaches by leveraging the ability of generative models to explore an ample design space of potential visualisations, some of which humans may not consider.
Tailoring visualisations to individual user preferences and context by training on historical user interactions.
However, I also noted some potential pitfalls that will need to be navigated:
Generative models can have biases based on their training data, which could lead to misleading visualisations if not correctly validated. Robust human-in-the-loop processes will be needed.
Bad actors could use the technology to generate fake data visualisations to spread disinformation. Verification frameworks may be required for high-stakes use cases.
Over-reliance on generated visualisations could atrophy data visualisation and interpretation skills in the human workforce. Ongoing training will be required.
Explaining and troubleshooting issues with generated visualisations could be challenging given the black-box nature of deep learning models currently. More interpretable generative models may be required (Liang et al., 2021).
The responses to my initial post brought up additional considerations. One respondent noted that generative AI could help make data visualisation more accessible to users with disabilities by automatically generating alt-text and other accessibility features. Another highlighted the potential for generative AI to create more engaging, narrative-driven data stories. However, a third respondent cautioned that generated visualisations should augment rather than replace human judgment, as there are risks of model bias and hallucination. Incorporating this feedback, I believe organisations will need robust frameworks to validate generated visualisations, provide transparency to end users, and empower analysts to leverage generative AI as a tool for augmenting rather than replacing their expertise. By proactively addressing these considerations, generative AI could have a profoundly positive impact on the future of data visualisation and enable more people to engage in data-driven decision-making. While there are challenges to navigate, the potential benefits make this an exciting trend to watch.
References
Ali, S., Ravi, P., Williams, R., DiPaola, D. and Breazeal, C. (2024). Constructing Dreams Using Generative AI. Proceedings of the AAAI Conference on Artificial Intelligence, [online] 38(21), pp.23268–23275. doi:https://doi.org/10.1609/aaai.v38i21.30374.
Liang, Y., Li, S., Yan, C., Li, M. and Jiang, C. (2021). Explaining the black-box model: A survey of local interpretation methods for deep neural networks. Neurocomputing, 419, pp.168–182. doi:https://doi.org/10.1016/j.neucom.2020.08.011.
Turchi, T., Carta, S., Ambrosini, L. and Malizia, A. (2023). Human-AI Co-creation: Evaluating the Impact of Large-Scale Text-to-Image Generative Models on the Creative Process. Lecture Notes in Computer Science, pp.35–51. doi:https://doi.org/10.1007/978-3-031-34433-6_3.