Machine Learning (ML) has attained greater academic and commercial significance in recent years. As organizations seek to extract actionable information and greater insights from data, the ability offered by Machine Learning to enhance and automate such processes has gained traction.
The commercial promise of Machine Learning has caused the emergence of several key concepts, methods and practitioner toolkits. Whilst initial Machine Learning drivers stemmed largely from artificial intelligence considerations as well as developments with visualization technology, the paradigm itself continues to shift inexorably towards greater levels of complexity and utility. Aspects such as “Deep Learning” and “Natural Language Processing (NLP)” have attracted increased attention worldwide.
I studied the key concepts, theories, techniques, and practices that underpinned Machine Learning. I looked at the main architectural, usage, and deployment models that characterized Machine Learning.
Provide you with an in-depth understanding of established techniques of machine learning, its real-world application and the legal contexts in which machine learning operates.
Provide you with comprehensive knowledge of the nature of data and the mechanism that may be used to pre-process data to support machine learning activities.
Establish a comprehensive and practical awareness of the techniques and metrics used to evaluate machine learning algorithms.
Furnish you with an in-depth and critical knowledge of a range of established approaches to machine learning, including their statistical and mathematical underpinning.
Provide a wide-ranging practical knowledge of an established machine learning workbench.
Topic
Machine Learning systems typically offer businesses several distinct advantages. The benefits include improved agility with knowledge extraction from data, enhanced adaptability and better modeling capabilities. A number of ML algorithm types and deployment patterns are available, and organizations have to make appropriate selections, to ensure that they make optimal use of Machine Learning.
Research and reflect on specific ML algorithm types and deployment patterns that have been used by known organizations.
Research online sources, including news articles related to the history of robotics solving world problems.
Reflect on your personal experiences on design of a robot that solves one of the world issues will look.
discuss the Machine Learning algorithm types and deployment patterns that have been used by a known commecial organization.
Post
Netflix actively leverages machine learning in the development and utilization of its recommendation system. Specifically, to enhance its search system, Netflix dynamically constructs a real-time adaptive recommendation system by harnessing user interactions within the current session. Through this, it predicts user needs and provides improved recommendations (Bhattacharya & Lamkhede, 2022). Collaborative Filtering and Content-based Filtering algorithms are employed to analyze users' viewing habits and recommend movies and TV programs (Netflix et al., 2016).
Netflix actively applies principles related to Continuous Deployment. The company is dedicated to automatically deploying new code changes to its core services after subjecting them to testing and validation. In pursuit of this, Netflix has established a large-scale automation and testing infrastructure, ensuring both stability and efficiency (Amazon et al., 2012).
Machine Learing Algorithms in Recommendation Systems
Collaborative Filtering
Advantages
Data-Driven: It generates personalized recommendations based on diverse user behavioral data.
Scalability: The scalability of collaborative filtering methods is enhanced by efficient matrix factorization, allowing for the management of large-scale user-item interactions (Koren, Bell, & Volinsky, 2009).
Disadvantages
Cold Start Problem: While collaborative filtering can address cold start issues, it still faces difficulties in recommending for new users or items with extremely limited interactions. (Koren, Bell, & Volinsky, 2009)
Computational Costs: In cases with a large number of users or items, operations like similarity calculations can become complex.
Continuous Deployment
Continuous Deployment is a methodology in software development and deployment that automates the process and rapidly delivers software through frequent updates. While this approach enables efficient development and deployment, it does have some limitations. Below are approaches to overcome these limitations
Limitation
Balancing Complexity and Stability: The continuous changes in software development and deployment can increase complexity and lead to unforeseen issues, challenging the balance between stability and reliability. (Amazon et al., 2012).
Mitigation Approach
To maintain stability and reliability, prepare contingencies for failures and recovery strategies in advance. Detect and address issues early through automated testing and monitoring. (Amazon et al., 2012).
Comparison between Netflix and its competitors
Let's examine the comparison between Netflix and its competitors in terms of the utilization of Collaborative Filtering and Content-based Filtering algorithms, as well as distribution patterns leveraging distributed systems and cloud infrastructure.
Strengths of Netflix
Personalization and Recommendation Accuracy
Netflix possesses the capability to offer personalized recommendations by employing a variety of algorithms. By combining Collaborative Filtering and Content-based Filtering, it provides accurate recommendations considering users' past viewing history, preferences, and item characteristics.
Weaknesses of Netflix
Diversity and Exploration Issues: Netflix's recommendation system tends to rely heavily on users' past viewing history, which can make it difficult to discover new genres or diverse content.
While other competitors may have personalized recommendation systems similar to Netflix's, there can be differences in the following aspects:
Utilization of ML Algorithms
Competitors can employ various ML algorithms beyond Collaborative Filtering and Content-based Filtering. They might develop or enhance recommendation systems using techniques such as Deep Learning or Reinforcement Learning.
Recommendation Accuracy and Diversity
Competitors may attempt innovative approaches to address diversity and exploration issues. For instance, they could develop Hybrid recommendation systems that combine diverse algorithms to provide recommendations.
References
Amazon, J.R. et al. (2012) 'Resilience engineering: Learning to embrace failure: A discussion with Jesse Robbins, Kripa Krishnan, John Allspaw, and Tom Limoncelli', Queue, 10(9), Available at: https://dl.acm.org/doi/10.1145/2367376.2371297
Bhattacharya, M. and Lamkhede, S. (2022) 'Augmenting Netflix search with in-session adapted recommendations', arXiv.org, Available at: https://arxiv.org/abs/2206.02254
Netflix, C.A.G.-U. et al. (2016) 'The Netflix Recommender System: Algorithms, business value, and innovation', ACM Transactions on Management Information Systems, 6(4), Available at: https://dl.acm.org/doi/10.1145/2843948
Koren, Y., Bell, R., & Volinsky, C. (2009) 'Matrix factorization techniques for recommender systems', Computer, 42(8), 30-37. Available at: https://ieeexplore.ieee.org/document/5197422
Summary
Machine learning is a branch of computer science and artificial intelligence that uses data and algorithms to imitate how humans learn, gradually improving accuracy. Machine learning uses algorithms to turn various data sets into models to make predictions or identify patterns from new data. Various machine learning algorithms are employed for specific tasks and objectives. For instance, the simple linear regression method applies to prediction tasks such as forecasting stock market trends, while the KNN algorithm is suited for classification problems. Machine learning's varied algorithms require tailored approaches, data quality, and ongoing evaluation for effective utilization, benefiting diverse industries.
Executive Summary
In my initial post, I discussed the importance of machine learning algorithm types and deployment patterns in the context of Netflix organization. I highlighted the benefits of machine learning systems, such as improved agility, adaptability, and modeling capabilities. I also mentioned that Netflix organizations must make informed choices when selecting machine learning algorithm types and deployment patterns to maximize their benefits (Databrick, 2023).
During the class discussions, I received valuable feedback from my peers, which provided different perspectives and insights. One of my peers shared a response mentioning the possible problem of sample bias in the data used for assessment and training while talking about Netflix's recommendation system. The other peer responded by utilizing Netflix's collaborative filtering and content-based filtering models to improve the recommendation systems.
Reflecting on these discussions, I have realized the importance of considering each organization's specific needs and constraints when choosing various machine learning algorithm types and deployment patterns (Barla, 2022). There is no universal solution that fits every situation; hence, it is suitable to choose a customized approach. I have also gained a deeper understanding of different machine-learning approaches' potential challenges and benefits.
In response to the class discussions, I have adjusted my initial perspectives. I now appreciate the complexity of machine learning implementation and the need for a holistic approach that considers data quality, model interpretability, and scalability. I have also learned that organizations should continuously evaluate and iterate on their machine-learning systems to ensure they remain effective and aligned with their goals (WEI, 2023).
Conclusion
My journey through this course has emphasized that machine learning is a versatile tool with the potential to revolutionize various industries. The importance of tailored approaches, data quality, and ongoing evaluation cannot be overstated. Organizations must carefully consider the complex landscape of machine learning to harness its full potential effectively.
A student-information-system (SIS) intends to include additional ML-based insights into its management reporting suite. One of the csv data files used to prime the SIS Machine Learning application has been found to have significant data quality issues.
You have been asked to provide advice and guidance on the steps that need to be taken to clean the data file as part of quality assurance for the ML system.
Requirements
Perform detailed analysis of data quality for the datasetprovided.
Map out, in outline form, what data cleansing measures would need to be put in place to prepare the dataset for ML work.
Indicate the types of Pandas-Scikit-Learn python commands that could be used whilst carrying out the measures you suggested in task 2.
Attempt a clean-up of the dataset using the procedures set out in (2) and (3) and report on the degree of success with carrying this out.
The report focuses on presenting a comprehensive analysis of the data presented and the data cleansing process for the student information system (SIS) dataset. The dataset is intended for machine learning applications, in which the results will be used for ML algorithms and create accurate results on the student information. Therefore, the main interest is to learn and showcase how missing data can be cleaned and ways that would improve the results and even sustain the collected data for machine learning (Dong and Peng, 2013). Researchers should always focus on ways that improve quality assurance, and this also calls for indi-viduals to improve on expectation-maximization, which provides quality data and information to the intended audience. Therefore, based on the provided data, it can be found that the missing data proportion is around 10%, and this shows that the analysis will lead to wrong results.
The provided data was scrutinized, and several key issues were recorded and as-sessed. The first issue was missing data, and this was noted in the 'location' col-umn. and the best solution was to fill the location with the words 'unknown.' The second issue under missing data was rows with missing 'Report To' values, and this was removed as the column was important for the data analysis (Jeon et al., 2019). The second issue was on the data type consistency, where the 'highest qualification' and highest qualification level' columns exhibited variations in data entry. Therefore, the best way was to apply standardization to categorize entries into 'Masters,' 'Doctorate,' 'Bachelors,' and 'Other.' The duplicate data in the col-umns with the same 'ID' were removed, and this ensured that each faculty mem-ber was represented once in the dataset. The last issue was value standardization, where the 'Join Date' values were converted to datetime format, and 'Titles' stripped off the extra spaces.
A. Handling Missing Data
Fill missing 'Location' values with 'Unknown.'
Remove rows with missing 'Reports To' values.
B. Data Type Consistency
Standardize 'Highest Qualification' and 'Highest Qualification Level' values.
The data cleaning process was easy and successful, and this gave a great report that would best applied to Machine Learning tasks. The values that were considered missing were correctly handled, and all the data type inconsistencies were resolved in the best ways. Additionally, the duplicate records were removed, and all the values were standardized to enhance uniformity (Schlomer et al., 2010). The provided Python code explains the steps taken to achieve the data cleaning and preparation, and the process yielded accurate insights as it supports the SIS Machine Learning system quality assurance.
References
Dong, Y. and Peng, C.-Y.J. (2013) ‘Principled missing data methods for researchers’, SpringerPlus, 2(1). doi:10.1186/2193-1801-2-222.
Jeon, G. et al. (2019) ‘Special issue on machine learning approaches and challenges of missing data in the era of Big Data’, International Journal of Machine Learning and Cybernetics, 10(10), pp. 2589–2591. doi:10.1007/s13042-019-01010-8.
Schlomer, G.L., Bauman, S. and Card, N.A. (2010) ‘Best practices for missing data management in counseling psychology.’, Journal of Counseling Psychology, 57(1), pp. 1–10. doi:10.1037/a0018082
Organizations often have to decide which of the two broad classes of techniques to use when setting up machine learning systems or attempting to solve problems requiring machine learning solutions.
This discussion invites you to compare and contrast the two classes of machine learning systems, and to explain what criteria to utilize when deciding which specific approach will be the most appropriate when developing a machine learning solution.
Compare and contrast supervised and unsupervised machine learning methods in general, whilst making specific reference to at least two ML modelling techniques in each of the two broad classes. Your comparison should highlight strengths, weaknesses, and challenges for each of the ML modelling techniques mentioned in your post.
Draw up structured criteria that can be used in determining the most appropriate ML approach for developing a machine learning solution to a particular problem.
Post
Machine learning is considered part of the algorithms that help to get patterns from data and give specific outputs for conclusive predictions. Therefore, to draw the best conclusions, there is a need to apply machine learning in the best ways by setting up machine learning systems.
Supervised machine learning
The first approach to consider is supervised machine learning, which relies on the labelled inputs, and this also considers cleaned data, which gives a better result in the algorithm. The model has to learn the relationship between the output data and labelled inputs. The two main examples that help to understand supervised machine learning well are classification and regression. In regression, the input features and the target variables have a linear relationship, and the best example is speech recognition and the automated classification of automated documents (Alloghani et al., 2020). Therefore, the linear regression ensures that the input label leads to the intended results, as the written language is automated in the same way. The limitation of the method is that it might fail to recognize non-linear correlations in the data labels.
The second example is classification, and this is applied as a method of identifying input data, which is part of learned data with labels. Therefore, the classification is enhanced in a way that data will be structured in a way that it will be grouped based on where it should lie. For example, ML can be designed to classify books or even emails, where they will be in classes based on the input data. The limitation of the classification is that the computing power might classify data in the wrong class, and this leads to wrong inferences.
Unsupervised machine learning
In contrast, unsupervised machine learning it applies learning processes with raw data, and it is most applied to cluster data and detect outliers that might lead to wrong predictions. The two examples of unstructured machine learning are means clustering and principal component analysis (Berry et al., 2019). Clustering is important as it helps to group data with similar characteristics. The data can be in markets, where market campaigns need clear data points, and the ML will help to assign resources in the clear procedures. The drawback of the example is the sensitivity to the initial positioning and assumptions that the clusters are spherical. The second method is PCA, and in ML, it is applied to reduce the dimensionality of data. The method is important as it increases the interpretability of the data, as the data is linked together to increase prediction probability. The drawback is that the method can lead to data loss, and the data can lead to inconclusive results.
Structured criteria
The structured criteria follow a directed path that overlooks the supervised and unsupervised learning techniques. The first point is to comprehend the characteristics of the issue and the data collected. This point overlooks how important it is to reduce the data loss and expenses to maintain the data. Therefore, when accuracy is needed, one has to consider the best method that will lead to the best results (Ozgur, 2004). Thirdly, the computational tools available need to be analyzed, where the processing power is considered for better results. For example, if one has to deal with deep learning models, they will need supervised learning as the data is structured in the best ways.
References
Alloghani, M., Al-Jumeily, D., Mustafina, J., Hussain, A. and Aljaaf, A.J., 2020. A systematic review on supervised and unsupervised machine learning algorithms for data science. Supervised and unsupervised learning for data science, pp.3-21.
Berry, M.W., Mohamed, A. and Yap, B.W. eds., 2019. Supervised and unsupervised learning for data science. Springer Nature.
Ozgur, A., 2004. Supervised and unsupervised machine learning techniques for text document categorization. Unpublished Master’s Thesis, İstanbul: Boğaziçi University.
Summary
Machine learning is a process that collects algorithms that help to extract and predict patterns that give a simplified decision in business and computing organizations. Based on the learned processes, the supervised and the unsupervised ML are both important and the application is based on the data that is presented for analysis. According to the post made by one of the peers, the best example that was shared was on the Convolutional Neural Networks (CNNs), which are utilized in computer vision and image classification tasks (Heaton, 2017). In my understanding, image classification tasks are applied in websites where they would like to detect whether they are robots or human beings, and they extract hierarchical characteristics from the images in the area of expertise. However, the main drawback was the computing power, which was high, and at times, the unstructured data might need cleaning before they are applied.
The second idea that I found better to implement in my discussion post is the K-Means Clustering, which shows that the data needs to be divided into discrete groups. The large datasets can be divided into smaller groups as it helps to detect anomalies which happen in the systems. Therefore, in my opinion, when one has large datasets, one can subdivide them into groups, and this helps to ensure that all errors can be recognized before any decision or prediction is made. On the other hand, structured ML is simple to apply as it is always straightforward because of the data classification. For example, on linear regression, one has to look at the input features, where the input data leads to a conclusive report because the prediction is guaranteed (Olive, 2017). This shows that when one has to choose between the two methods, the characteristics of the issue and the complexity of the data have to be analyzed. Secondly, the computational tools available have to be considered, whereby the computing power is recorded before any decision is made. This proves that when the data is labelled, one can apply supervised learning, while if the data is complex, one is free to change and apply unsupervised Machine learning.
References
Heaton, J. (2017). Ian Goodfellow, Yoshua Bengio, and Aaron Courville: Deep learning. Genetic Programming and Evolvable Machines, 19(1-2), pp.305–307. doi:https://doi.org/10.1007/s10710-017-9314-z.
You have been engaged as a contract data scientist by Athana Data Science Services (ADSS), a small company specialising in the provision of data science consultancy services to public and private sector organisations. ADSS have just been awarded a contract by a government department (the Department of Environment) to help with the development of machine learning-based models for predicting atmospheric emissions (and pollution) from data gathered by various borough and county environment monitoring units. Your team leader wants you to assist with this project, and you will be required to carry out a number of tasks using the Anaconda/Scikit-Learn Python ML framework and its components.
Datasets to be utilized for developing the ML models
The web page describes the various types of data held for monitored atmospheric emissions for the year 2013. Note that ADSS will ultimately be working on datasets compiled over a 50-year period, but you will be focusing only on a single year (2013), in the first instance, when developing the ML models.
Tasks
Identify and describe in some detail at least 3 machine learning algorithms/techniques that you intend to use in your project. Provide your reasons for selecting those ML methods.
Specify the types of predictive insights you expect to glean from the data after you have applied your ML models. Your response should be based on actual inspection of the datasets and should be as specific as possible.
Develop the respective ML models using your Jupyter notebook and Anaconda/Scikit-Learn toolkit to work on the datasets available on the website.
Assess the performance of each model using suitable ML metrics and explain in detail any differences in model performance.
Particulate Matter (PM), especially PM10, is a major contributor to air pollution with serious health effects (WHO 2016; Samet et al., 2000; Wang and Liu, 2018). The development of precise machine learning (ML) methods for predicting its concen-tration is imperative for understanding and controlling air pollution and for institut-ing suitable strategies alleviating its adverse impacts. This report details our pro-ject that aimed to design and evaluate the performance of such models based on a provided pollution dataset for (a single) year 2013. We focused on PM10 for two main reasons. First, its significant impact on premature mortality and the rate of deaths has made it a critical concern (Wallek et al., 2022) . Second, PM10 was selected due to its strong correlation with the explanatory variables (i.e., pollutants) in our dataset.
Given the continuous nature of pollutants' concentration levels, regression-based models are preferable . Therefore, to model PM concentrations, we optimised sev-eral ML algorithms, underscoring the complexity of the task and our aim to identify the best model through extensive experimentation .
Linear regression (LR) can provide precise predictions when applied to air pollution data, which is crucial for developing effective air quality management strategies (Eduk et al., 2018; Załuska and Gładyszewska-Fiedoruk, 2020; Joseph et al., 2021; Dhanalakshmi and Radha, 2022) .
In this context, Random Forest (RF) algorithm has gained popularity, attributed to its adeptness in managing complex datasets and its proficiency in handling non-linear data and missing values (Anıl & Ümit, 2022; Agibayeva et al., 2022; Ahmad et al., 2022; Siouti et al., 2022; Rao & Thangaraj, 2023). Furthermore, RF's capa-bility to provide feature importance scores offers valuable insights into factors con-tributing to air pollution.
Gradient Boosting (GB) is recognised for its ability to build and generalise models by optimising an arbitrary differentiable loss function, offering robustness to outliers, and often surpassing the accuracy of RF, especially with non-linear data (Singh et al., 2021; Ghanim et al., 2023; Hong & Lynn, 2020). Its aptitude for swiftly adapting to data pattern alterations renders it suitable for predicting pollution levels (Wei et al., 2019a; Wei et al., 2019b).
Ridge Regression (RR) demonstrates good performance in handling multicollinear-ity, a crucial aspect when dealing with environmental data, and its regularisation term aids in averting overfitting, especially pivotal when navigating through com-plex environmental datasets (Dhanalakshmi & Radha, 2023; Nowack et al., 2021; Weng et al., 2022). As a linear model, RR brings forth simplicity and computational efficiency, aligning well with applications where interpretability and computational resources are paramount.
Lasso Regression (LR) has been utilised in the context of air pollution (e.g., as in Hassan and Bhuiyan, 2021). It inherently performs feature selection by shrinking some of the coefficient estimates to exactly zero, which can be particularly useful when dealing with datasets having numerous predictors. It handles multicollinearity well (Cheng et al., 2020). LR provides sparse solutions and improved predictive accuracy, as compared to LR, especially when the true underlying model is sparse .
XGBoost often delivers superior predictive accuracy compared to other ML mod-els (Huang et al., 2023; Kriit et al., 2022; Shah et al., 2022; Cabaneros et al., 2022) and can capture non-linear relationships between predictors and the target variable (e.g., pollutant concentration) (Huang et al., 2023). XGBoost can handle missing data internally without requiring imputation (Kriit et al., 2022), less sensitive to mul-ticollinearity (Shah et al., 2022) and provides feature importance scores .
Neural Networks (NNs) are highly flexible and capable of learning complex pat-terns and non-linear relationships (Miller et al., 2020). Given the complexity of en-vironmental data, a NN can potentially uncover intricate relationships between dif-ferent features and air pollution levels (Lin et al., 2022; Pawul 2019; Ramentol et al., 2023). NNs can model complex relationships and discover intricate patterns in the data, making them ideal for predicting PM concentrations based on a multitude of environmental factors.
ML models were developed using Python libraries (i.e., Scikit-Learn and XGBoos) in a Jupyter notebook environment. The dataset was loaded from Excel files, pre-processed, split into training, testing and validation sets, and then fed into the models. Hyperparameter tuning was applied to optimise model performance, par-ticularly for the NNs. The 'Total' column was used as a proxy for PM10 since it en-capsulates all the available information. Various quality checks were performed thereafter. Data related to different pollutants was merged based on common iden-tifiers, creating a consolidated dataset. Specific columns were renamed for clarity and consistency .
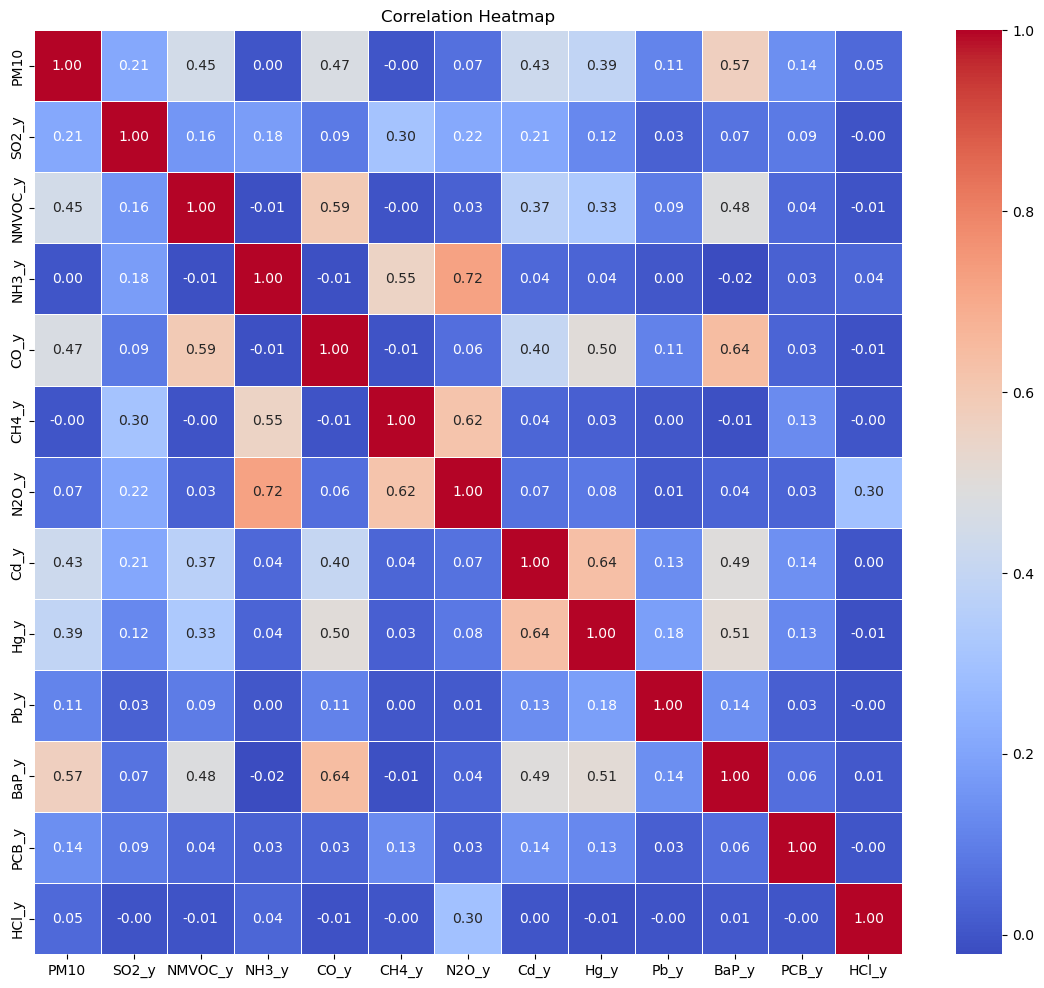
To explore the relationships between different pollutants, a heatmap was generat-ed, see Figure 1.
Figure 1. Heatmap: Correlations between variables.
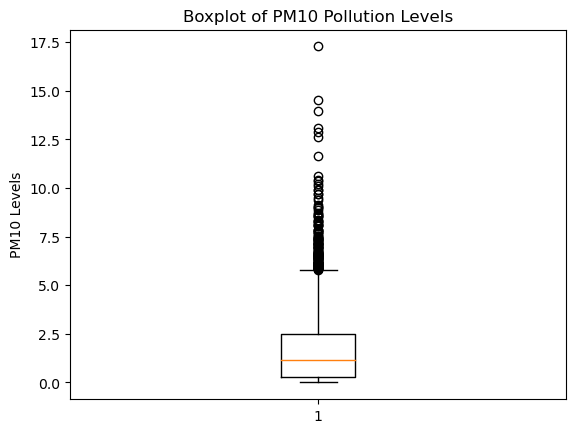
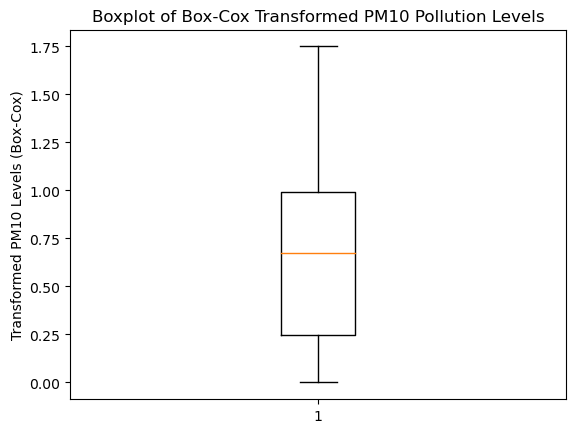
The correlation coefficients showed that PM10 has stronger associations with the variables of interest, which is crucial for explor-ing multifaceted interactions and dependencies. Hence, PM10 emerges as a more suitable choice for our study. We examined PM10 using a histogram and comput-ed summary statistics, and 151 outliers were identified (see Figure 2 and Figure 3).
Figure 2. PM10 before the Box-Cox transformation.
Figure 3. PM10 after the Box-Cox transformation.
Hence, applied different transformation techniques (i.e., loga-rithmic, a square root and the Box-Cox) and used a boxplot to assess their im-pact . Figure 2 shows PM10 before transformation. As seen in Figure 3, the out-liers were effectively addressed . Finally, duplicate columns and columns with high correlations were identified and removed to avoid multicollinearity. Lagged features of PM10 were created to potentially explore temporal relationships in fu-ture analyses. Resulting missing values were backward filled .
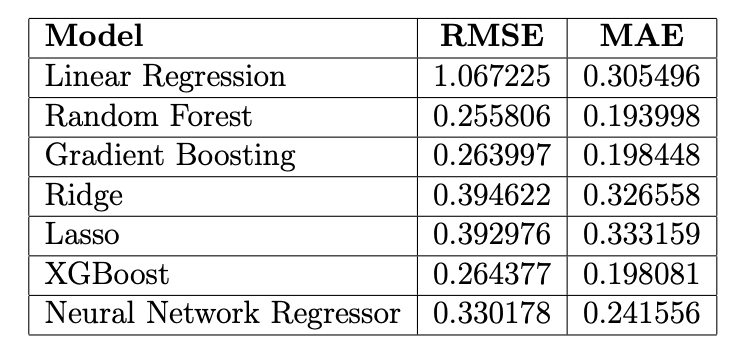
A suite of regression models was initialised and evaluated using 5-fold cross-validation. The Mean Absolute Error (MAE) and Root Mean Square Error (RMSE) were computed for each model and tabulated to compare their predictive perfor-mances. A grid search was performed on the NNs to optimise the hyperparame-ters . The model was evaluated using cross-validation to ensure a robust as-sessment . Both RMSE and MAE are measures of model error, and lower values indicate better performance .
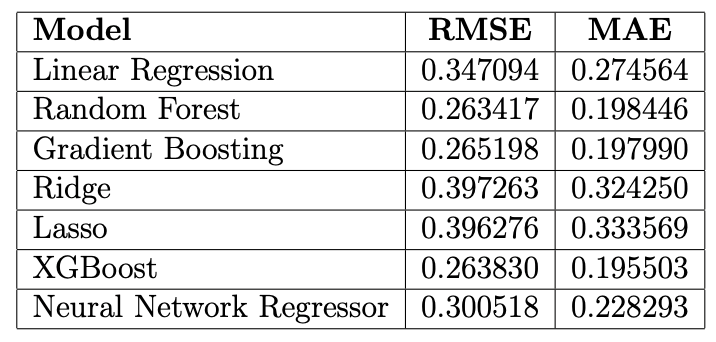
The results from the initial run are in Table 1;
Table 1. Results a.
and the final results are summarised in Table 2 (in Appendix). We can see some changes and improvements (e.g., in terms of LR). The RF model remains the best model with RMSE of 0.2459 and MAE of 0.1801. When comparing this test performance with its validation RMSE of 0.2634, the RF model's performance is consistent and even slightly better on the test set, which is a good sign of generalisation. Comparing across all models, RF, XGBoost, and GB models are the top three performers in terms of RMSE. Their performance is closely matched, with RF leading by a small margin in the valida-tion results.
Table 2. Results b.
The NN, though not matching the tree-based models, still outperforms the linear models (LR, Ridge, and Lasso) in terms of RMSE. Despite its simplicity and inter-pretability, LR yielded higher RMSE and MAE compared to ensemble models, re-flecting its limitations in handling the intricate, non-linear associations in the da-taset. Ridge and Lasso models did not significantly outperform the LR, suggesting that the added regularisation might not be particularly beneficial for this dataset, or the hyperparameters need further tuning. Finally, NNs demonstrates a viable op-tion given its flexibility and capability to model non-linearities. It outperforms the linear models, indicating its ability to capture more complex relationships in the data.
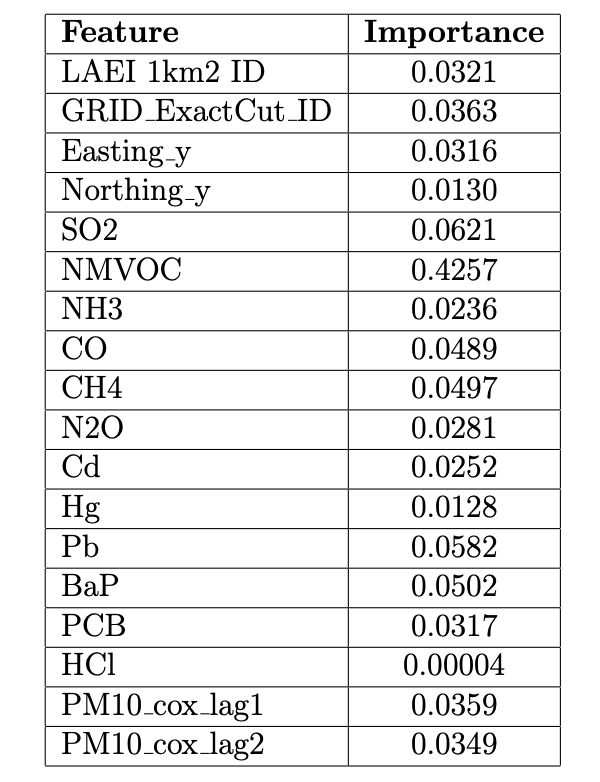
Table 3. Results for feature selection based on RF.
Understanding the impact of features within a model is crucial for interpreting the model’s decisions and deriving actionable insights . These values (computed for the RF model) provide insights into the relative influence of each feature in the model’s predictive decisions: Table 3 shows NMVOC (i.e., Non Methane Volatic Organic Compounds) is the most influential feature, with a prominence of approxi-mately 0.4257 . These results provide a foundational understanding of the varia-bles that are instrumental in predicting PM10, thereby guiding future research, model refinement, and policymaking by highlighting areas that warrant further in-vestigation and intervention.
Using these models offers a deeper understanding of how pollution behaves. We expect to learn at least the following:
Tree-based models, like RF and XGBoost, will show which features, like pollu-tion variables or traffic data, are most important in predicting air quality. This can help focus our strategies. These models might also pinpoint times or seasons when pollution peaks. Knowing this can help us craft timely warnings or policies.
With location data in our set, we could spot areas that consistently suffer from high pollution. Such insights will be crucial for targeted clean-up efforts.
Advanced models, like XGBoost and NNs, could unveil complex relationships between different factors and pollution. They might show us when and why air quality dips to unsafe levels, helping us take preventive measures. By studying the gaps in our models, we could see where they fall short or find unexpected trends in our data. This can help refine our models.
Tweaking what we feed into our models and watching their output will show which factors most sway pollution levels.
Lastly, different models might be better at predicting some pollutants than others. Understanding this can guide us on where to put our focus or show where we need more data. Also, testing our models in various settings will tell us how reliable they are across different situations or places.
To find the best performing model for predicting atmospheric emissions, we utilised various ML models, each revealing distinct insights and applicability in environ-mental data modelling. Ensemble models, especially RF, GB, and XGBoost, demonstrated a notable ability to navigate the data's complexity and non-linearity. While NN did not surpass tree-based models, it showcased the potential of deep learning (DL) in capturing complex data relationships, indicating a promising ave-nue for further optimisation and exploration. Conversely, Linear, Ridge, and Lasso models, despite their higher error metrics, emphasised the challenges linear mod-els face with complex datasets, highlighting the critical balance needed between model complexity, interpretability, and predictive accuracy.
Acknowledging the limitations of our study, constrained by available data and fea-tures, and the potential geographical and temporal specificity of the models, future work may explore alternative DL architectures, additional data sources, and im-plement model interpretability tools to enhance predictive performance and usabil-ity in practical applications. This ensures the development of models that are not only predictive but also comprehensible and trustworthy in navigating environmen-tal data complexities.
Agibayeva, A., Khalikhan, R., Guney, M., Karaca, F., Torezhan, A., & Avcu, E. (2022). An Air Quality Modeling and Disability-Adjusted Life Years (DALY) Risk Assessment Case Study: Comparing Statistical and Machine Learning Approach-es for PM2.5 Forecasting. Sustainability, 14(24), 16641.
Ahmad, N., Ul-Saufie, A. Z., Shaziayani, W. N., Abidin, A. W. Z., Elis, N., Zulazmi, S., & Harb, S. M. (2022). Evaluating the Performance of Random Forest and Mul-tiple Linear Regression for Higher Observed PM10 Concentrations. Israa Universi-ty Journal of Applied Science (IUJAS), 6(1), 72-90.
Ameer, S., Shah, M. A., Khan, A., Song, H., Maple, C., Islam, S. U., & Asghar, M. N. (2019). Comparative Analysis of Machine Learning Techniques for Predicting Air Quality in Smart Cities. IEEE Access, 7, 128325-128338.
Anıl, U. T. K. U., & Ümit, C. A. N. (2022). Deep Learning Based Air Quality Predic-tion: A Case Study for London. Türk Doğa ve Fen Dergisi, 11(4), 126-134.
Cabaneros, S., Calautit, J., & Hughes, B. (2020). Short- and Long-Term Forecast-ing of Ambient Air Pollution Levels using Wavelet-Based Non-Linear Autoregres-sive Artificial Neural Networks with Exogenous Inputs. Ecohydrology & Hydrobiol-ogy, 3(2), 143-154.
Cheng, X., Huang, K., Qu, L., Zhang, T., & Li, L. (2020). Effects of Vehicle Re-striction Policies on Urban Travel Demand Change from a Built Environment Per-spective. Journal of Advanced Transportation.
Dhanalakshmi, M., & Radha, V. (2022). Discretised Linear Regression and Mul-ticlass Support Vector Based Air Pollution Forecasting Technique. International Journal of Engineering Trends and Technology, 70(11), 315-323.
Dhanalakshmi, M., & Radha, V. (2023). Novel Regression and Least Square Sup-port Vector Machine Learning Technique for Air Pollution Forecasting. International Journal of Engineering Trends and Technology, 71(4), 147-158.
Eduk, A. R., Leo, C., Andrew, A., & Mudiaga, C. O. (2018). Prediction and Model-ling of Dry Seasons Air Pollution Changes using Multiple Linear Regression Mod-el: A Case Study of Port Harcourt and its Environs, Niger Delta, Nigeria. Interna-tional Journal of Environment, Agriculture and Biotechnology, 3(3).
Ghanim, A. A., Shaf, A., Ali, T., Zafar, M., Al-Areeq, A. M., Alyami, S. H., ... & Rahman, S. (2023). An Improved Flood Susceptibility Assessment in Jeddah, Saudi Arabia, using Advanced Machine Learning Techniques. Water, 15(14), 2511.
Hassan, S., & Bhuiyan, M. A. (2021). Probable Nexus between Methane and Air Pollution in Bangladesh using Machine Learning and Geographically Weighted Regression Modelling. Journal of Hyperspectral Remote Sensing v, 11(3), 136-145.
Hong, S., & Lynn, H. S. (2020). Accuracy of Random-Forest-Based Imputation of Missing Data in the Presence of Non-Normality, Non-Linearity, and Interaction. BMC Medical Research Methodology, 20(1), 1-12.
Huang, W., Wang, S., Wang, L., Song, Y., Zhu, Y., Yang, H., Xie, Y., & Hu, Y. (2023). Source Apportionment of Soil Heavy Metal (Loid)s in Farmland Using Di-verse Models: A Comparative Assessment in the Yellow River Delta. Journal of Marine Science and Engineering, 11(5), 1069.
Joseph, J., Furl, C. V., Sharif, H., Sunil, T., & Macias, C. G. (2021). Towards Im-proving Transparency of Count Data Regression Models for Health Impacts of Air Pollution. Applied Sciences, 11(8), 3375.
Kriit, H., Andersson, E., Carlsen, H., Andersson, N., Ljungman, P., Pershagen, G., Segersson, D., Eneroth, K., Gidhagen, L., Spanne, M., Molnár, P., Wennberg, P., Rosengren, A., Rizzuto, D., Leander, K., Yacamán-Méndez, D., Magnusson, P., Forsberg, B., Stockfelt, L., & Sommar, J. (2022). Using Distributed Lag Non-Linear Models to Estimate Exposure Lag-Response Associations between Long-Term Air Pollution Exposure and Incidence of Cardiovascular Disease. International Journal of Environmental Research and Public Health, 19(5), 2630.
Lin, C., Yousefi, S., Kahoro, E., Karisani, P., Liang, D., Sarnat, J., & Agichtein, E. (2022). Detecting Elevated Air Pollution Levels by Monitoring Web Search Que-ries: Algorithm Development and Validation. JMIR Formative Research, 6(12), e23422.
Miller, T., Cembrowska-Lech, D., Kisiel, A., Kołodziejczak, M., Krzemińska, A., Jawor, M., ... & Mosiundz, S. (2023). Advancing water quality monitoring through artificial neural networks: present insights and future opportunities in scientific ex-ploration. Scientific Collection «InterConf+», 3(151), 399-409.
Naiman J., & Song P.X. (2022). Multivariate Functional Kernel Machine Regres-sion and Sparse Functional Feature Selection.Entropy. 24*(2), 203.
Nowack, P., Konstantinovskiy, L., Gardiner, H., & Cant, J. (2021). Machine learn-ing calibration of low-cost NO 2 and PM 10 sensors: Non-linear algorithms and their impact on site transferability. Atmospheric Measurement Techniques, 14(8), 5637-5655.
Pawul, M. (2019). Application of Neural Networks to the Prediction of Gas Pollu-tion of Air. New Trends in Production Engineering, 2.
Ramentol, E., Grimm, S., Stinzendörfer, M., & Wagner, A. (2023). Short-Term Air Pollution Forecasting Using Embeddings in Neural Networks. Atmosphere, 14(2), 298.
Rao, N. S. S. V. S., & Thangaraj, S. J. J. (2023, April). Flight Ticket Prediction us-ing Random Forest Regressor Compared with Decision Tree Regressor. In 2023 Eighth International Conference on Science Technology Engineering and Mathe-matics (ICONSTEM (pp. 1-5)). IEEE.
Samet, J., Dockery, D., & Schwartz, J. (2000). The Impact of PM10 on Human Health. Environmental Health Perspectives, 108(4), 477-484.
Shah, M. H., Salem, S., Ahmed, B., Ullah, I., Rehman, A., Zeeshan, M., & Fareed, Z. (2022). Nexus Between Foreign Direct Investment Inflow, Renewable Energy Consumption, Ambient Air Pollution, and Human Mortality: A Public Health Per-spective from Non-linear ARDL Approach. Frontiers in Public Health.
Seyedzadeh, S., Rahimian, F. P., Rastogi, P., & Glesk, I. (2019). Tuning Machine Learning Models for Prediction of Building Energy Loads. Sustainable Cities and Society, 47, 101484.
Siouti, E., Skyllakou, K., Kioutsioukis, I., Patoulias, D., Fouskas, G., & Pandis, S. N. (2022). Development and Application of the SmartAQ High-Resolution Air Qual-ity and Source Apportionment Forecasting System for European Urban Areas. At-mosphere, 13(10), 1693.
Singh, U., Rizwan, M., Alaraj, M., & Alsaidan, I. (2021). A Machine Learning-Based Gradient Boosting Regression Approach for Wind Power Production Fore-casting: A Step towards Smart Grid Environments. Energies, 14(16), 5196.
Wallek, S., Langner, M., Schubert, S. & Schneider, C. (2022) Modelling Hourly Particulate Matter (PM10) Concentrations at High Spatial Resolution in Germany Using Land Use Regression and Open Data, Atmosphere, 13(8), 1282.
Wang, X., & Liu, Y. (2018) A Deep Learning Approach for PM10 Prediction. Envi-ronmental Pollution, 238, 1013-1021.
Weng, X., Forster, G. L., & Nowack, P. (2022). A Machine Learning Approach to Quantify Meteorological Drivers of Ozone Pollution in China from 2015 to 2019. Atmospheric Chemistry and Physics, 22(12), 8385-8402.
Wei, L., Yuan, Z., Zhong, Y., Yang, L., Hu, X., & Zhang, Y. (2019a). An Improved Gradient Boosting Regression Tree Estimation Model for Soil Heavy Metal (Arse-nic) Pollution Monitoring using Hyperspectral Remote Sensing. Applied Sciences, 9(9), 1943.
Wei, L., Huang, C., Wang, Z., Wang, Z., Zhou, X., & Cao, L. (2019b). Monitoring of Urban Black-Odor Water Based on Nemerow Index and Gradient Boosting Deci-sion Tree Regression using UAV-Borne Hyperspectral Imagery. Remote Sensing, 11(20), 2402.
World Health Organisation (2016). Ambient Air Pollution: A Global Assessment of Exposure and Burden of Disease; WHO: Geneva, Switzerland.
Załuska, M., & Gładyszewska-Fiedoruk, K. (2020). Regression Linear Model of Air Pollution Emission on the Example of a Waste Incineration Plant. In Proceedings, 51(1), 32. MDPI.