EKMS
WKKim
08/23/2024
CSharp
WPF
SQL
MVVM
DevExpress
Overview
- This project involves developing software to analyze training data independently or evaluate and analyze it against expert data during virtual training for different modes of transportation.
Key Tasks
- UI Development Based on Design: Develop the UI based on the UI storyboard decided in team meetings.
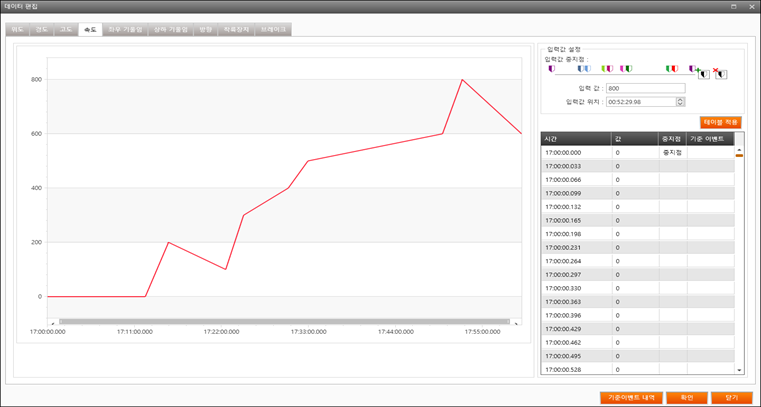
- Training Data DB Management: Process and perform statistical analysis on single/multiple training data.
- Map and Coordinate Visualization Development: Display coordinate data from training data on maps/2D coordinate systems/3D coordinate systems.
Challenges & Solutions
- Understanding and applying the unfamiliar WPF and MVVM design pattern.
- Repeatedly studied articles and example codes related to the MVVM pattern posted on MSDN to improve understanding.
- Developed from easy code and performed my role according to the development schedule.
Lessons Learned
- Realizing that there are frameworks other than WinForm broadened my perspective as a C# developer.
Challenges & Solutions
- When rendering the movement paths of training data in a 3D coordinate system, it was necessary to render numerous points to make them appear as straight lines.
- There was a task to create virtual points between two points recorded in the DB to make the movement path appear continuous.
- As the number of points to render increased, performance rapidly degraded.
- Determined the location of the generated points by calculating the unit vectors in the xyz coordinates through the concept of 3D vectors and considering the size of each rendered point.
- Limited the maximum number of points to be rendered on the 3D chart and determined the location and number of generated points according to the scale and size of the points.
Lessons Learned
- re-studied the concept of 3D vectors and learned the importance of compromising on performance to address issues related to performance degradation.